
One of the most important benefits of taking a DNA test is the matches that you receive. DNA Matches reveal many relatives you never knew about before, based on shared DNA inherited from common ancestors. However, the relationships to your DNA Matches can be confusing. This results in many users not understanding how they are related to most of their DNA Matches, which holds them back from using the matches to advance their family history research and make new discoveries.
Today we’re excited to announce the release of cM Explainer

DNA Matches are characterized by the amount of DNA shared between two individuals, measured using a unit of genetic distance called centimorgans (cM). cM Explainer
cM Explainer
How cM Explainer
cM Explainer
The ages of the two people who match each other are instrumental in predicting their relationship. They help rule out impossible relationships and adjust probabilities when multiple relationships are possible. For example, half siblings typically share the same amount of DNA as a grandparent and grandchild. But if the two people are of a similar age, they are probably half siblings. If they are 60 years apart, they are more likely to be a grandparent and grandchild. Other relationships may be possible for the same amount of shared DNA, such as an uncle and nephew, and knowing the ages can help determine which one is more likely. In many cases, the ages don’t make a selection clear-cut, but they affect the probability of each possible relationship, providing useful predictions you can apply to your research.
To maximize the accuracy of the relationship predictions, MyHeritage’s Science team developed an age algorithm by first examining age difference distributions among parents and children, and siblings (calculated separately for full and half siblings), based on extensive research using empirical aggregated data from family trees.
We further derived age difference distributions for all other relationships by combining those for parents, siblings, and children along a standard genealogical path. For example, the distribution of the age difference between an uncle and his nephew (see bottom graph below) is estimated by considering all potential ages of the nephew’s parent, and then adding the age difference between the nephew and his parent (see middle graph) and the age difference between the parent and the uncle (see top graph). On the graphs below, you can see that the average age difference for Parent, Uncle/Aunt, and Parent’s Cousin are similar, but the distribution is more widespread for Uncle/Aunt, and even more so for Parent’s Cousin because of the additional age differences between siblings. More generally, using the age difference allows us to rule out some relationships and assign more accurate probabilities to the remaining possible relationships. Since shared DNA and age difference complement one another, this method provides better results than those provided by shared DNA alone, and is useful even when only one individual’s age is known.


Empirical age difference distributions for Full Siblings (top), Parent (middle), and Uncle/Aunt and Parent’s Cousin (bottom)
A game changer for genetic genealogy
Existing relationship prediction tools often suggest a range of possible relationships that is too broad to be useful, such as “3rd to 5th cousin”, or list many relationships with the same probability, leaving the user confused. cM Explainer
cM Explainer
For example, in a DNA Match where there are 1,600 cM of shared DNA between two people who are age 35 and 40, MyHeritage will tell the user simply that the match is most likely a half-sibling with 90.4% probability, whereas other tools would state a 100% probability for the match to have any of the following possible relationships: grandparent, aunt or uncle, half sibling, niece or nephew, or grandchild, leaving the user baffled. This makes cM Explainer
Using cM Explainer
For users who have DNA results on MyHeritage, select “DNA Matches” from the DNA tab on the main navigation bar.
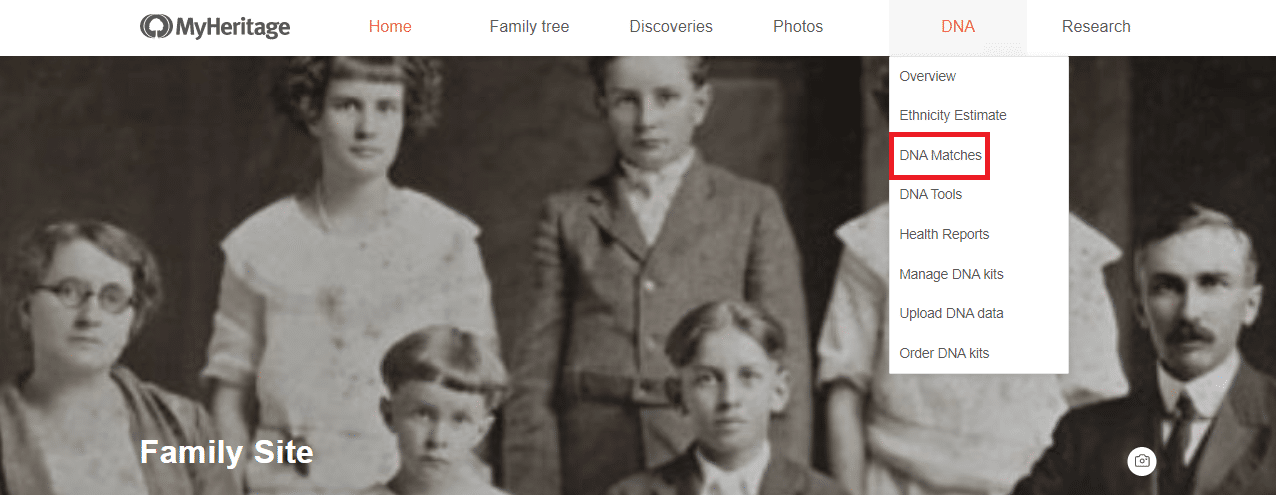
Accessing DNA Matches (click to zoom)
The page lists all your DNA Matches. Each DNA Match card shows one or more probable relationships between you and a match. This replaces the broader range of “Estimated relationships” that previously appeared.
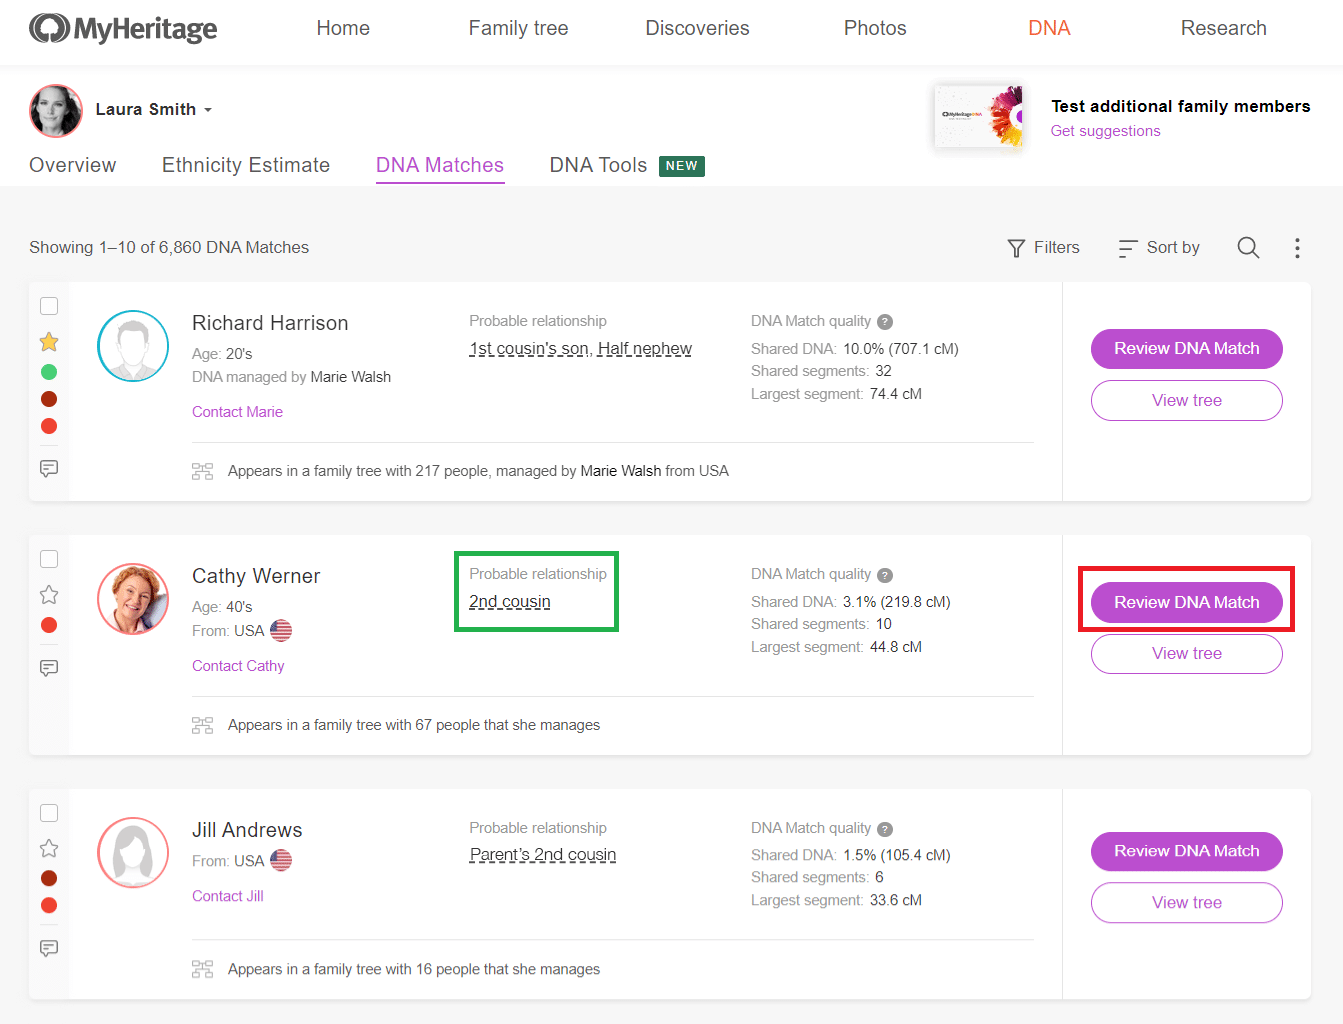
DNA Match list showing probable relationships (click to zoom)
To obtain more information on a probable relationship, click it (for example, the relationship marked with a green rectangle in the above screenshot). A popup will appear displaying all possible relationships estimated by MyHeritage, and their respective probabilities.

Possible relationships between Cathy Werner and Laura Smith (click to zoom)
The probable relationship indicates how the match is related to you. If it says “Aunt”, this means the match is your aunt, not that you are the aunt of the match.
More information on possible relationships appears on the Review DNA Match page. To get there, click the “Review DNA Match” button (marked with a red rectangle in the above screenshot of the DNA Match list).

Review DNA Match page listing possible relationships (click to zoom)
A new section was added to the Review DNA Match page, called “Possible relationships”. It shows how this person who is your DNA Match might be related to you, together with the probability for each relationship and the likely Most Recent Common Ancestor(s). This term, often abbreviated to MRCA, is the closest shared ancestor from whom you and your DNA Match are directly descended. This could be a single ancestor or a pair, depending how the match is related to you. In a full relationship the MRCA will be a pair of ancestors, and in a half relationship, it will be a single ancestor. For example, with a full first cousin, your MRCA are your grandfather and grandmother. But with a half sibling, your MRCA is one of your parents, not both.
The list of possible relationships displays the top 4 relationships, listed in descending order based on their probabilities. Click “Show more relationships plus diagram” to view other possible relationships having lower probability, as well as a diagram that shows the paths to those possible relationships.

Top possible relationships and a link to view all of them (click to zoom)
The diagram of possible relationships displays the relationship paths to the DNA Match, along with the probability for each relationship.

Diagram of possible relationships (click to zoom)
Use the drop-down on the top right to have the diagram to show full relationships, half relationships, or all relationships. This ability is unique to MyHeritage, and allows you to focus on specific relationship types.
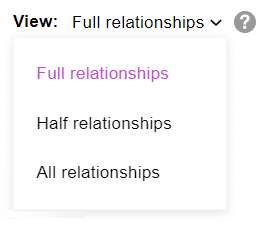
Filtering the diagram by relationship type (click to zoom)
The reason we provided this selector is to simplify the diagram. The probabilities always add up to 100%, but if you are viewing only full relationships or only half relationships, some of the possible relationships may not be displayed and the probabilities shown will add up to less than 100%.
In the example shown above, there are 4 options of full relationships, the most probable one being a 2nd cousin with a probability of 85%. Selecting “Half relationships” from the drop-down shows 3 additional options having a much lower probability.

Viewing half relationships (click to zoom)
Selecting “All relationships” from the drop-down displays all 7 possible relationships, together with their probabilities, as shown below.

Viewing all possible relationships (click to zoom)
Another unique feature of cM Explainer

Showing MRCA probabilities (click to zoom)
In this example, the MRCA is very likely your great-grandparents at 85% probability. Note that the MRCA is described based on the relationship to you, not your DNA Match. For example, your great-grandparents might be more distant ancestors for your DNA Match, such as great-great-grandparents.
The examples that were shown above are from a case where the ages of you and your DNA Match are known. While cM Explainer
Below the list of possible relationships is an explanation of how the predictions were calculated. If only one age is known, it will say so, as in the example below.
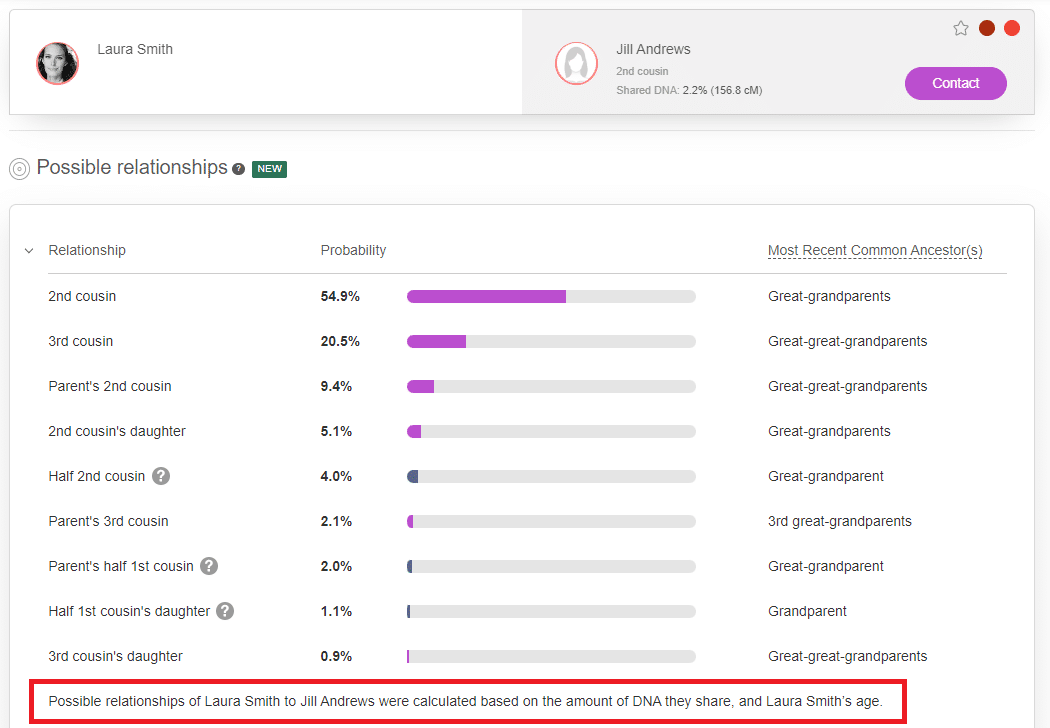
Relationship predictions when only one age is known (click to zoom)
Using the standalone cM Explainer
In addition to viewing cM Explainer
To get started, visit myheritage.com/cm. You can also access the tool by selecting “DNA Tools” from the DNA menu on the main navigation bar, or clicking the “DNA Tools” tab from any page of your DNA results.
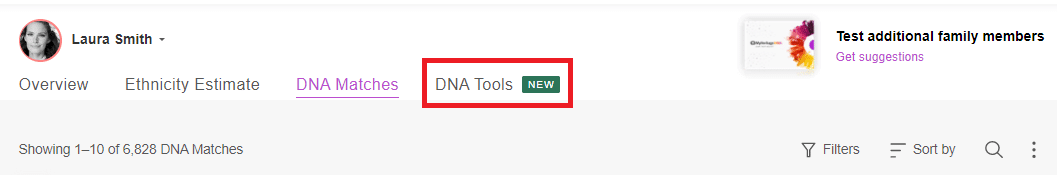
DNA Tools tab (click to zoom)
A new card is displayed for the cM Explainer
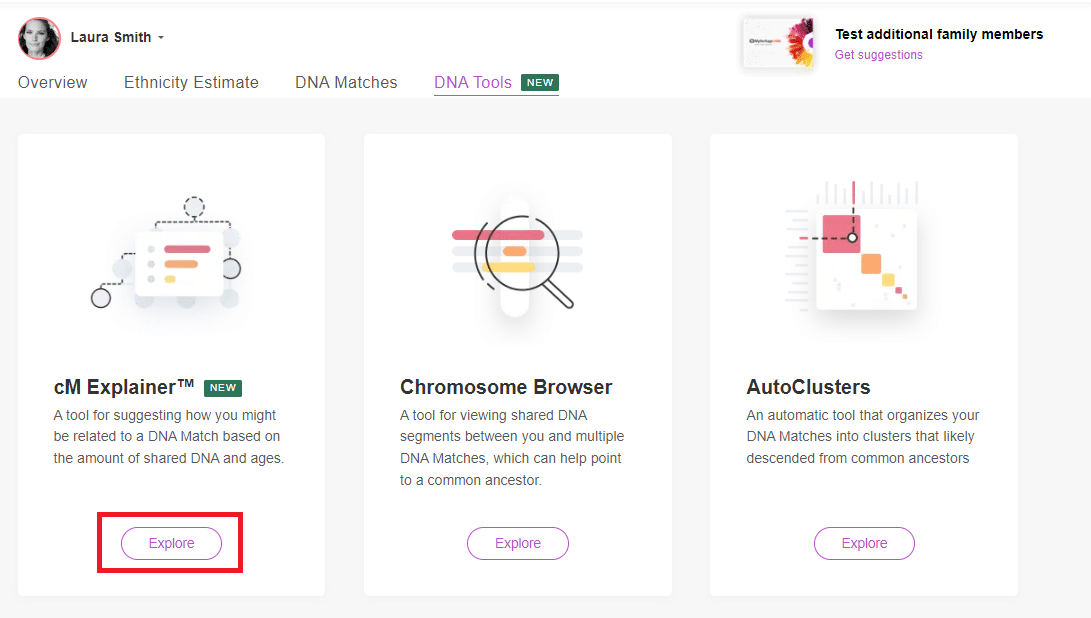
Accessing cM Explainer
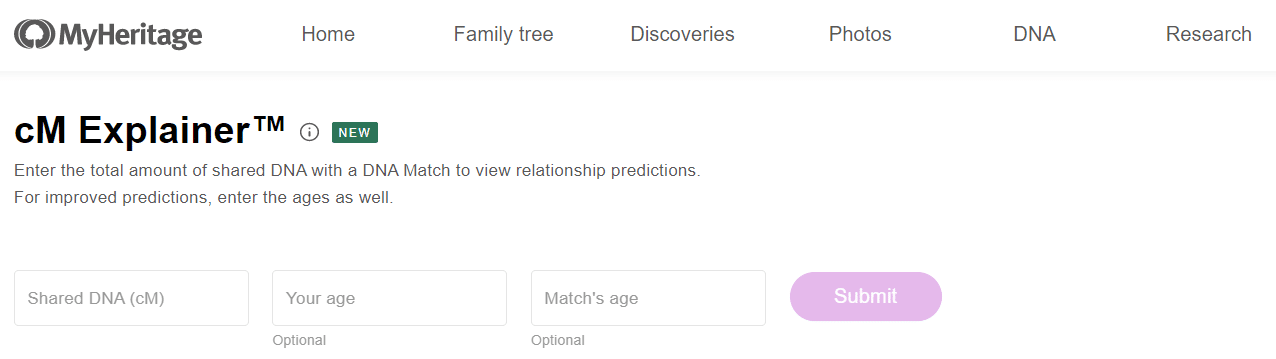
Standalone cM Explainer
Enter the amount of shared DNA between two matches, and their respective ages, if known. If you don’t know one of the ages, or don’t know both ages, that’s fine. cM Explainer

Viewing possible relationships in the cM Explainer
The user interface for the cM Explainer
In the following example with 500 cM, only one person’s age is known, and the tool still delivers results that have a high probability: this match is a parent’s 1st cousin, with 73.1% probability.

Results when only one age is known (click to zoom)
It’s free!
cM Explainer
Endogamy and pedigree collapse
In some situations, the relationship to a DNA Match may be more complicated. When there is endogamy or pedigree collapse, the two individuals may have shared DNA from multiple common ancestors, and would therefore have a larger amount of shared DNA (a higher cM value) than expected for the same relationship. To avoid an increase in complexity and confusion, cM Explainer
Summary
At MyHeritage, we’re committed to developing new features and tools to help improve your family history research, and in the domain of DNA testing, to help you better understand your DNA Matches. cM Explainer
This makes cM Explainer
Explore your DNA Matches today or try the cM Explainer
The post Introducing cM Explainer™ to Predict Relationships Between DNA Matches With Greater Accuracy appeared first on MyHeritage Blog.
Source: My Heritage